A dashboard approach to care
Infographics to give insight and oversight from the helicopter to the magnifying glass
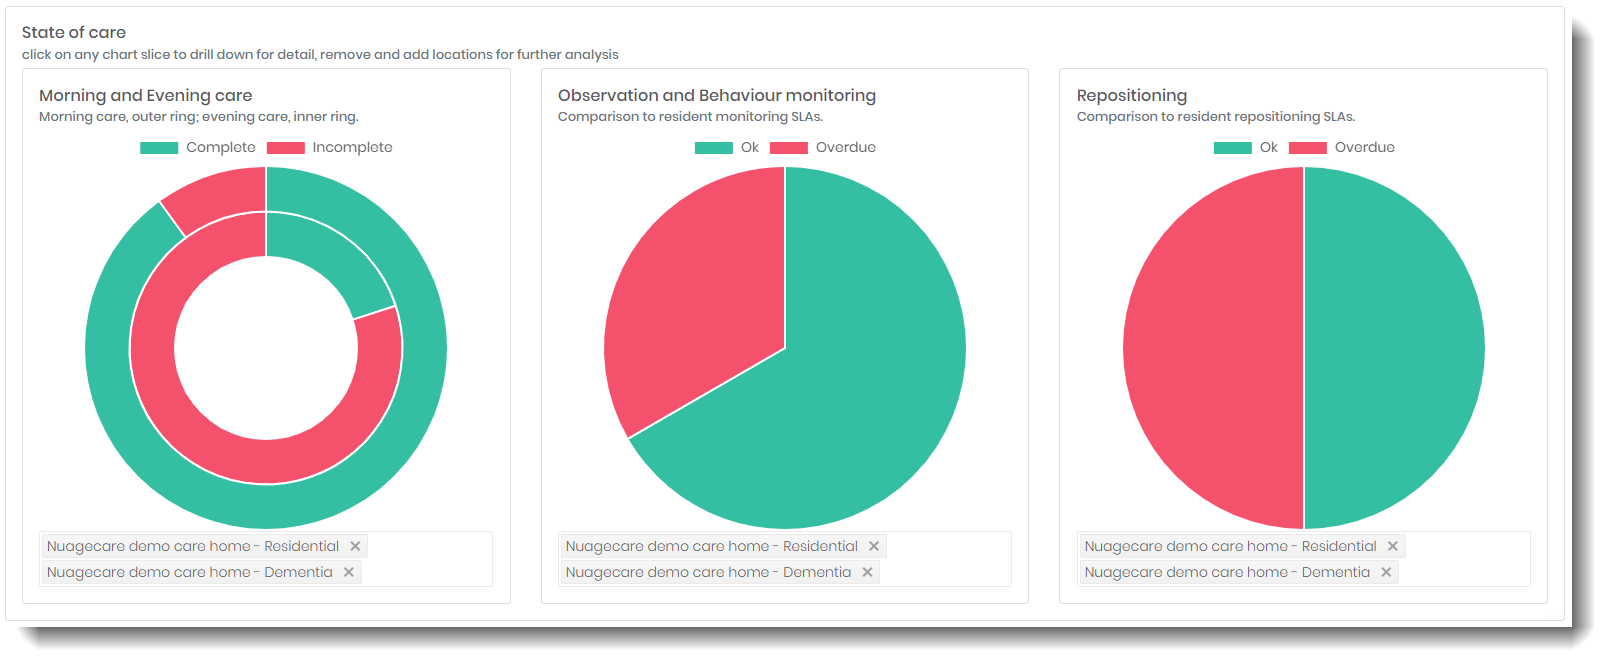
Intuitive graphics with drill-down functionality allowing you to see the finest of detail.
Intuitive infographics and plain English
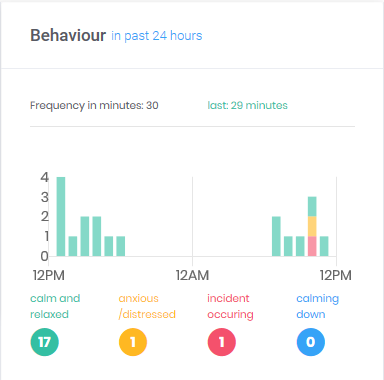
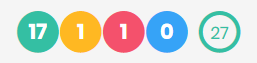
Joan has been observed 19 times in the past 24 hours and was last observed 27 minutes ago. On one occasion an incident was occurring shortly after being monitored as anxious.
Behaviour infographic
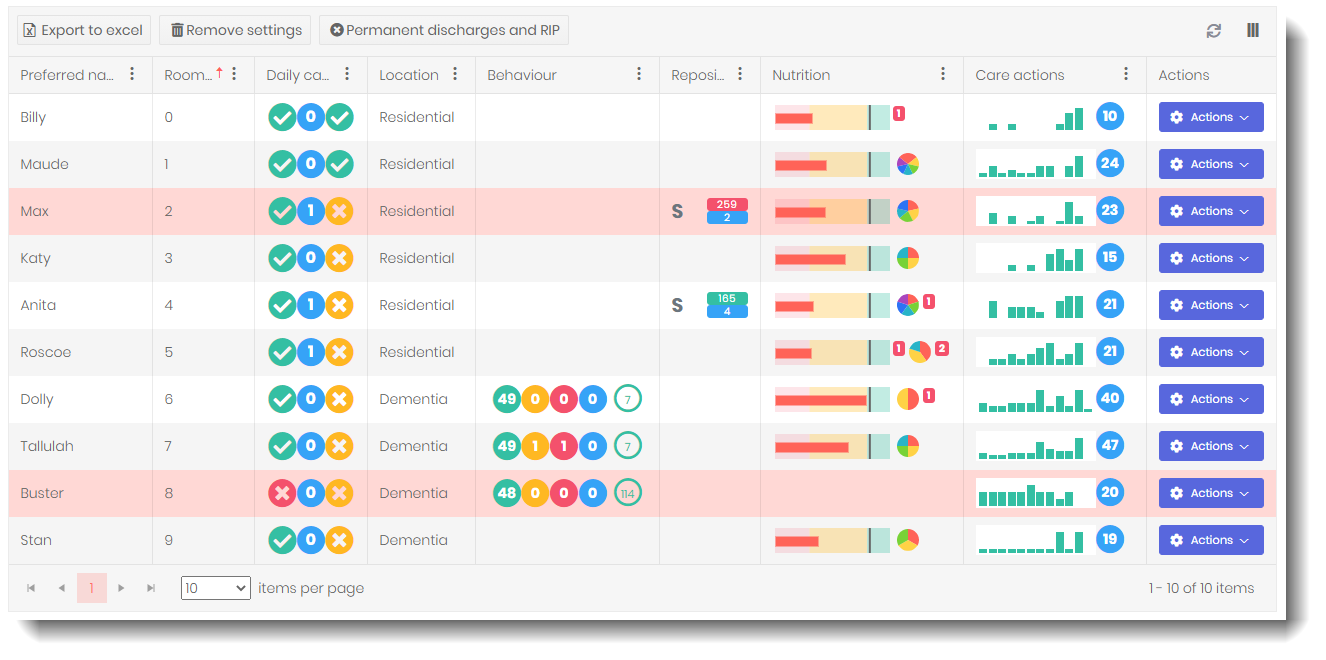
The resident grid
Everything you need for oversight in one place for a choice of locations
resident grid
What, at first, looks complicated is easily explained in less than a minute.
Daily care

Our daily care widget shows us we have delivered morning care when the first circle is green and ticked. In this example we have not delivered daily care for Buster in Room 8, and maybe we need to investigate why this is. Our last circle shows us where we have delivered evening care, currently for Billy and Maude. We have set a target of 20:00 for all evening cares to be completed so the final circle for most of our residents is coloured yellow - after 20:00 it will be red. The blue circle in the centre shows us the number of care notes we have input under the CQC recommendation of at least two each day.
Observation and behaviour monitoring
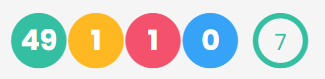
The grid shows us that we currently have three residents with observation agreements in place. Tallulah has been observed 51 times in the past 24 hours and was last observed 7 minutes ago. Most of the time (49) she was noted as calm and relaxed, but on one occasion an incident occurred shortly after being monitored as anxious. The final circle shows us when we last observed Tallulah; if this was outside of our SLA (in this instance we have agreed to monitor every 30 minutes) the outer circle and central number would be coloured red.
Repositioning and skin care
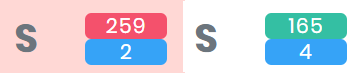
The grid shows us we currently have two residents with repositioning agreements in place. Max, the infographic to the above left, has been repositioned twice today and last positioned 259 minutes ago when he was sat out. Because our agreement is to reposition max every 240 minutes the value is boxed in red showing attention is needed. Anita has been repositioned four times today and was last repositioned 165 minutes ago, because our agreement with Anita is to reposition her every 180 minutes the value is boxed in green. Values for last position can be modified but as standard we have left, right, back, sat out and active.
Nutrition
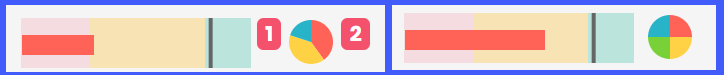
Our nutrition infographic is designed to give you at-a-glance oversight of fluid and food intake for each resident, highlighting any concerns.
Food and fluid charts can be set for each resident, in the resident grid example above only Buster does not have nutrition monitoring.
The infographic to the above left is for Roscoe. The image to the left is a bullet chart which shows us the amount of fluid currently taken in red, against the target for the day, represented by the black vertical line at the start of the green section. The value (1) boxed in red shows us Roscoe has also declined fluid on one occasion today. Because it's already early evening we should be encouraging Roscoe to take more fluid. The small pie chart shows us Roscoe has eaten three times today but has also declined food on two occasions. Rolling over the pie slices will give us even more information. In contrast the infographic to the above right shows us Tallulah has almost hit her fluid target for the day, has eaten four times and declined neither food nor fluid.
Care delivery
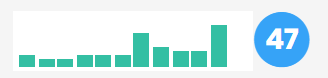
Another infographic in the resident grid is for care delivery. In the infographic above we can see that in the past 12 hours we have evidenced 47 care actions for Tallulah. This gives us a quick and easy way of ensuring each and every one of our residents is receiving the care they deserve.
Try it out!
Follow the link below to take the Nuagecare app for a test drive:
demo.nuagecare.net
Use the following login details to experience what the nuagecare web portal has to offer:
- Username: amyh
- Password:Nuagedemo!
